Demonstrating ‘Typical’ Conditions

The latest in PJA’s series of technical posts changes focus slightly, this time concentrating on traffic data input and justifying its suitability for use in microsimulation modelling.
As always, we acknowledge that these are not ‘set-in-stone’ methodologies and other techniques and processes may well exist. In the case of this post, we encourage feedback to understand how other traffic modellers and practitioners are demonstrating ‘typical’ traffic conditions in the data they are using to establish some common themes and formats.
This post has arisen as a result of a growing tendency in external VISSIM model audits to ask for evidence to prove that the traffic data used in the model was ‘typical’ and similar to that of ‘neutral’ traffic conditions.
This post discusses what ‘neutral’ and ‘typical’ conditions are and then sets out the methodologies that we have adopted for justifying that the traffic data collected is suitable.
Firstly, what are ‘neutral’ conditions?
In accordance with TAG Unit M1.2, section 3.3.6, neutral conditions are defined in Figure 1.

Figure 1 – TAG Definition of Neutral Conditions
There is also an argument that mid-January and February could also be used as neutral conditions, away from school holidays and inclement weather conditions.
In terms of the time periods surveyed, we tend to request 0700-1000hrs and 1600-1900hrs for AM and PM peak periods respectively (unless otherwise advised/specified by the Client). This allows the associated peak hours to be determined, as well as times and lengths for warm up and cool down periods.
So, what about ‘typical’ conditions?
Typical and neutral conditions tend to be used interchangeably and effectively mean the same thing. Our suggested definition of ‘typical’ is the “normalised average traffic performance within a specified network/road/cordon”
Ok, so how can we prove the data collected is typical?
Different consultants seem to have different methodologies for assessing data. We have adopted a two-stage approach for checking data. This consists of:
1) A check that the month that the data was collected in falls within certain confidence intervals over a 12 month period;
2) A check that the actual data collected is representative when compared against other data sources.
Check 1 – Check of Survey Month
To check that the month that the traffic survey was undertaken is representative, we use the following methodology:
1) Undertake a review of all the local TRADS sites and permanent counters in the area around the network surveyed using Webtris (http://webtris.highwaysengland.co.uk/) and identify sites which are active and have recent data.
2) Aim to extract data from a minimum of 4 sites – 2 x Motorway (Both Directions) and 2 x A Roads (Both Directions) if possible/ relevant to the modelled extents.
3) Extract ‘daily total’ data (Tues, Weds and Thurs) to profile over 12 months (ideally with survey date in the middle, or at least within the 12 months identified).
4) Undertake calculations to identify the mean and upper/lower 95%ile confidence intervals for each site individually and then as a whole to determine if the survey month falls within this range.
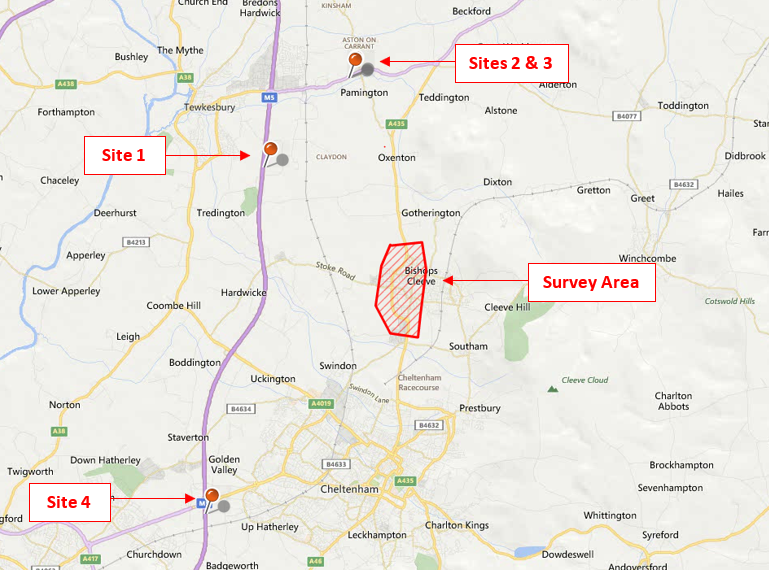
As an example, we have used a previous project to demonstrate this methodology and show how the data collected in January 2017 for use within the model compared to the Webtris data from a suitable 12 month period (see Figure 2 for Sites and Survey Area).

Figure 2 – Sites & Survey Area
The results for each site are shown in Figures 3, 4, 5 and 6.
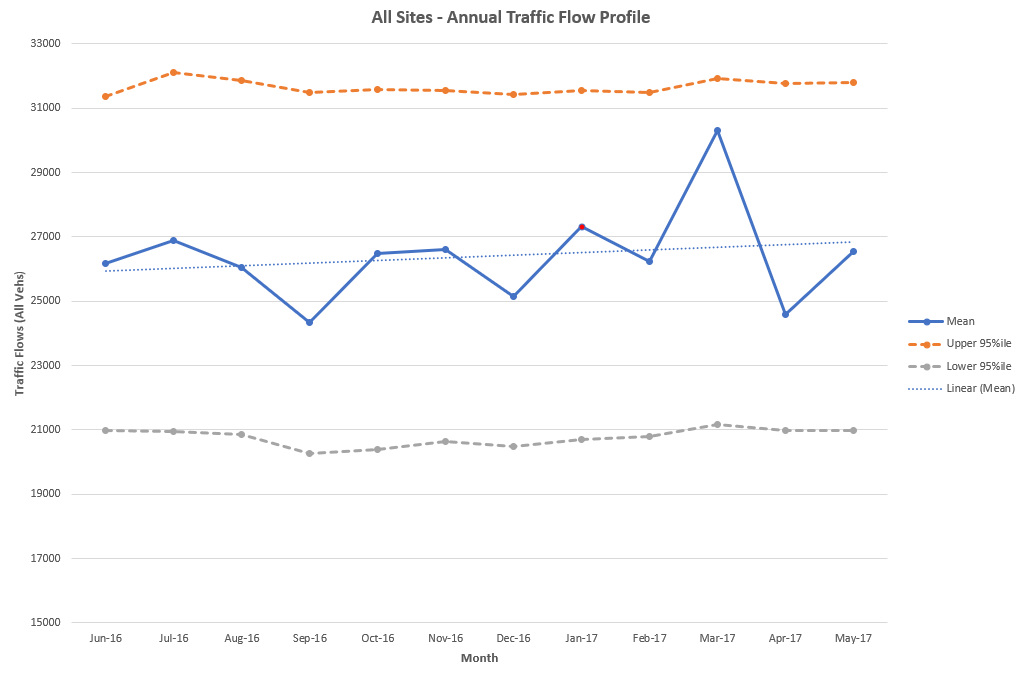
The figures above show how the mean (blue line) varies for each month over a 12 month period. The orange and grey lines show the upper and lower 95%ile limits, demonstrating that the mean is generally within these limits. However, the figures also show that if the survey was undertaken in March or April 2017, then these outputs would likely be considered ‘typical’ as they are higher and lower than the linear mean and, in some cases, higher than the upper 95%ile and (almost) lower than the lower 95%ile.
As a final check, the totals for all sites have been added together to produce a combined annual profile, which can be seen in Figure 7.

Figure 7 – Sites 1-4 Combined – Annual Profile
From Figure 7, it can be seen that the March and April 2017 spikes are still apparent and that the survey date of January 2017 can be considered typical as this falls close to the linear mean and within the upper and lower 95%ile limits.
Check 2 – Check of Survey Data
When collecting data for traffic modelling projects, this usually consists of a combination of the following:
– Classified Turning Counts (CTCs);
– Automatic Traffic Counts (ATCs);
– Queue Lengths;
– Journey Times (collected commonly through either Automatic Number Plate Recognition (ANPR) surveys or the ‘floating car’ method).
The CTC, Queue Lengths and journey Time surveys tend to be collected on a single day, whilst ATCs will be collected over a one or two-week period (including the main survey day).
For the data collected on a single day, it is very difficult to check that this data is representative as there are no other associated datasets to compare it to (unless multiple days have been surveyed). Therefore, the check of the survey day data relies on the ATC collected over the two-week period.
We use the following methodology when assessing the ATC data to check the survey day:
1) Choose a minimum of 4 ATC sites to analyse (with data for a full two-week period)
2) Plot the ‘daily’ totals for Tuesday, Wednesday and Thursday for both weeks and highlight survey day to check suitability against the other days.
3) Use the data collected for each ATC site to produce an overall comparison table, adding together all the flows for each day surveyed to give an overall plot for comparing against the survey day.
As an example, we have used a previous project to demonstrate this methodology and show how the data collected on Tuesday 5th December 2017 compared against the two-week average.
Figures 8 to 15 demonstrate that the survey day has daily flow values that are similar to the totals for the other neutral days over the two-week period. This is consistent for all ATC sites and for all directions collected. This provides evidence that the survey day data is representative of ‘typical’ conditions.
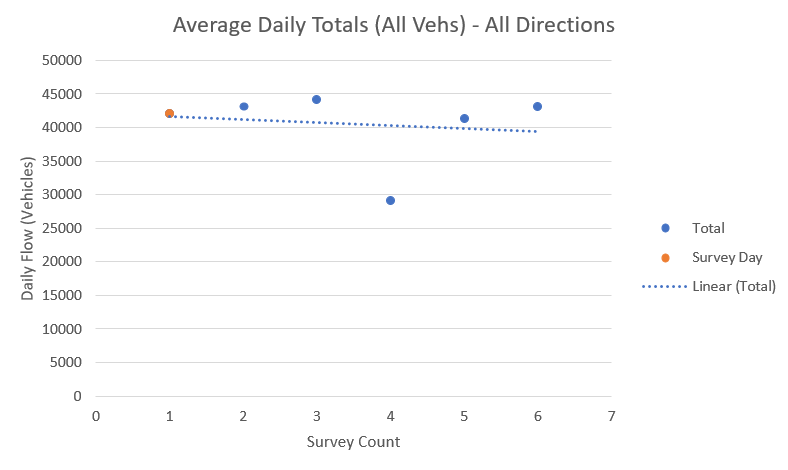
The final check, which looks to combine all of the daily totals, can be seen in Figure 16.

Figure 16 - All ATC Sites - All Directions
This provides a neat summary for all the ATC sites and demonstrates that when comparing against the daily totals from all of the neutral days collected, the survey day continues to show comparable results.
This is a good start, but there’s still continuous development to be done
Whilst the methodologies described in this blog go some way to providing an evidence base for confirming that the survey time and data was representative, there is certainly still room for further development and refinement.
For instance, there are still some key questions that require consideration:
- Are there steps that can be taken to check that the proposed survey date is ‘typical’ before any surveys are commissioned? We can check that the time periods are ‘neutral’ using the TAG criteria, but is there any upfront analysis that could be done to choose an appropriate survey time?
- What is the best way for checking the one day count data? (MCC’s, Queues, ANPR etc.) Should there be a focus to collect this data for a Tuesday, Wednesday and Thursday so that further analysis and checking could be undertaken? This then leads to further questions – would this lead to better calibrated and validated models if data could then be averaged over the three days? More importantly, would the Client be happy to pay for the additional data and work undertaken?
- We have also been receiving audit comments in relation to smoothening the MCC data to the ATC data. Is this common practice? We consider MCC’s more accurate than ATC data, so should this be factored by a different dataset? Or should more data be collected (referring back to the first bullet point)?
- If only one week of ATC data has been collected, is this enough? Is comparing the survey day data against two other days enough to draw justifiable conclusions? We feel that those undertaking the modelling need to be closely involved in the traffic survey specification production to ensure that the data collected is appropriate, but this isn’t always possible.
Final Comments
The methodologies provided in this post help to provide some justification and evidence to demonstrate whether traffic survey data collected is ‘typical’ and representative.
It is acknowledged that there are other methodologies out there for assessing the data, but we feel these provide a couple of useful, quick checks to undertake. However, these are likely to develop over time, as answers to some of the key queries requiring further thought become clear.
We hope this helps other traffic practitioners and modellers and very much welcome feedback both on our methodologies and other methods used for effective traffic data analysis.